Tesla diagnostics — Next level vehicle access
Key Highlights
- Tesla’s diagnostic ecosystem has become far more aftermarket-friendly, with Toolbox subscriptions dropping from $3,000 annually to $700 per year, plus a $75 24-hour option. Tesla service information is now also free to access.
- Tesla’s Toolbox platform offers advanced remote diagnostics, allowing technicians to remotely access vehicle data, pull logs, run Autodiag routines, and even activate Service Mode Plus after owner authorization.
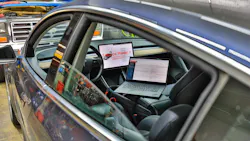
- Tesla wiring diagrams are especially powerful because they link directly to a Connector Reference Database containing connector locations, terminal details, seals, and supplier part numbers, allowing shops to source components independently through suppliers like Mouser or DigiKey.
- Tesla vehicles rely heavily on DoIP (Diagnostics over Internet Protocol) for diagnostic communications, even though most vehicle systems still operate on CAN networks. This makes Tesla’s diagnostic workflow different from many traditional OEMs.
- The Service Shell “Terminal Mode” gives technicians command-line access to massive vehicle data dumps through commands like “ldvs,” enabling deep analysis of battery health, system conditions, and fault patterns — even allowing AI tools to help interpret complex diagnostic data.
In context, Tesla is a relatively new car company, and their diagnostic approach is quite different than other manufacturers. However, some of the vehicle technology closely mirrors that of some other vehicle manufacturers you may be familiar with. In fact, Mercedes-Benz made significant investments in Tesla in its early years. If you’ve ever been in an early Model S, you’ll quickly recognize the driver's master power window switch-pack and shift lever. Most of the vehicle systems use CAN, but most of the diagnostic communications use DoIP.
When you’re using Toolbox (Tesla’s diagnostic application), you will encounter a few terms that may seem odd if you happen to be one that never followed Greek or Norse mythology. Odin is Tesla’s Diagnostic API (application programming interface). The relationship with Odin and Norse mythology is that Odin is the chief god associated with wisdom, war, poetry, magic, and secret knowledge.
During remote vehicle access, you’ll encounter a reference to Hermes, which is what Tesla refers to as a lightweight service data transport mechanism. Hermes is the Greek Olympian god who serves as the herald/messenger of the gods. He is the swift, boundary-crossing deity who travels freely between the mortal world, the divine realm, and the underworld. He's the patron of communication, travelers, commerce, trickery, and messengers and intermediaries.
I wrote an article about Tesla Diagnostics around 3-years ago, and a lot has changed since then. I can confidently report that it has evolved nicely for the aftermarket.
Covered in that article was how to go about subscribing to Tesla’s Toolbox application. Back then, the annual cost was $3,000 US, and today, it’s $700 annually and $75 for a 24-hour sub. Today, a Toolbox application also provides you with access to the Theory of Operation for the various vehicle models, and most recently, they have added more video content. Also covered in that article was the cost of the service and repair information, which is now free to all. You may have also noticed that your favorite aftermarket service information provider may have added Tesla SI to the mix. However, one of the more powerful features of Tesla’s wiring diagrams is the direct connection to their Connector Reference Database, which contains location information along with connector supplier part numbers for the housings, terminals, seals, and more. What does this mean? Well, for one, you can head on over to Mouser, Digikey, or other suppliers and purchase what you need instead of going through Tesla (Figure 1).
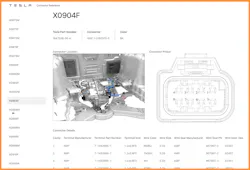
When it comes to the diagnostic process, in most cases, you can enter service mode from the touchscreen, and then check for active alerts and their data payload to quickly obtain perspective (Figure 2). From there, you may be able to pull up additional diagnostic panels on the touchscreen without the use of any special tools. However, with Toolbox, one has access to additional service tools. One of the advanced tools is remote vehicle access.
Remote vehicle access
Here is what Tesla has to say about remote access regarding owner authorization requests:
An owner can authorize an independent repair workshop or Tesla technician to access more service information and actions for up to one week. Authorization requests are sent to the owner's email as needed, and authorization can be revoked at any time. For example, an owner can authorize access shortly before an appointment or while the vehicle is at an independent repair workshop.
From a repairer's perspective, the process to request access to vehicle data is:
- A vehicle needs service, and the owner provides the VIN and their Tesla-registered email address before bringing their vehicle to the workshop
- The technician submits an access request via Toolbox
From a vehicle owner's perspective, the process to authorize access to their vehicle data is:
- The owner needs the vehicle serviced and provides the VIN and email before bringing their vehicle to the workshop
- Owner receives an email from [email protected] asking them to click a link to approve the use of diagnostic tools on their vehicle for a specific period
Once the owner authorization request is approved by the owner, the following information and tools are remotely available to the repairer from within Toolbox:
- Garage - used to view live signal and alert information
- Remote Repair Commands - used to execute vehicle commands with remote principles
- CAN Explorer - used to retrieve and view signals and alerts previously set on the vehicle
The workflow I recommend after obtaining remote access is to visit the Garage page as indicated above. Then visit the CAN Explorer page and pull the data logs from the period where the client has reported trouble. From there, the service alerts panel can be accessed, and the payload data from those alerts can be loaded up in the viewer for more context. However, if you know what systems are involved, you can access the Actions section, activate a live vehicle connection, and then run the Autodiag tool related to the suspect system. Now, if you forgot to pull logs, the Actions panel will provide you with the option to perform the log pull and subsequently run the Autodiag program. Beware, Autodiag may not always be conclusive and could be incorrect. It is up to the diagnostician to use his or her skills to arrive at a proper diagnosis.
Here is an example:
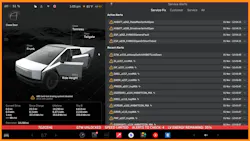
Step 1: Connect to vehicle (either remote or local) (Figure 3)
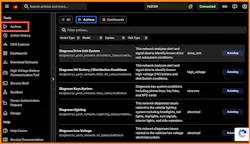
Step 2: Select Actions
Step 3: Select the system for Autodiag
Step 4: Set start and stop times and verify log availability (Figure 4)
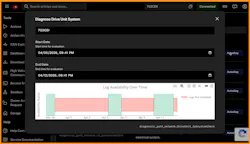
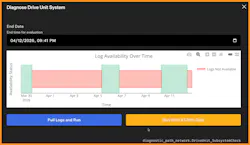
Step 5: Select option Pull Logs and Run or Run with X% of Data (Figure 5)
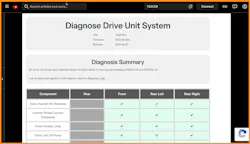
Step 6: Wait for results and review (Figure 6)
With Toolbox, the service technician has access to many service tools, and when connecting to the vehicle locally, Service Mode Plus can be activated. However, you can also trigger Service Mode Plus remotely, which may come in handy if you’re working with another shop remotely who doesn’t have a Toolbox subscription. Once the vehicle is placed into regular Service Mode and authorization has been obtained from the vehicle owner, access the vehicle via Toolbox and make a remote connection. Once connected, go to Actions and search for Service Mode. You should see Service Mode Plus Authentication. Select it and run (Figure 7).
Signals
The CAN Viewer can be used to review not only data from the past, but live data as well (Figure 8).
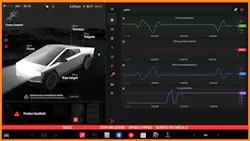
Once you’re in Service Mode Plus, you can view live data on the vehicle display as well (Figure 9).
Data research – Articles
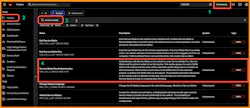
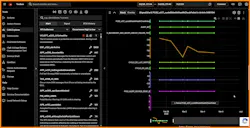
During analysis, you may come across articles that may help you uncover additional evidence to help support your diagnosis. Figure 10 demonstrates this. Here, the system found potential alerts along with payload data that may prove to be helpful.
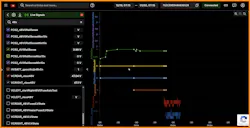
Clicking on the “View plots for the selected range” will result in the data as shown in Figure 11.
In some cases, you may be presented with a list of alerts and warnings that may be overwhelming. Tesla has an organizational tool to assist with this called Sandbox. You can think of Sandbox as a place to gather documents and see how they relate. When you load up documents, you’ll see them arranged from left to right with symptoms, causes, and corrections, making it easier to parse through the information in a timely manner (Figure 12).
When it comes down to circuit testing, high voltage (HV) system checks, network diagnostics, and others, you can typically use the same tools you use on other vehicles. Safety is always job one, and Tesla’s SI will point that out at the beginning of the procedure. They will also list the HV training requirements and/or the aftermarket equivalencies. As mentioned in the beginning, with a Toolbox subscription, one has access to the Theory of Operation, which contains tons of great information. Additionally, the video section offers short training videos with subjects covering Picoscope, DVOM use, and more.
Terminal Mode — Service Shell
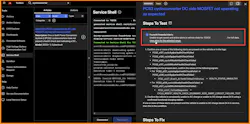
One last area I’d like to mention is the Service Shell area. You can think of Service Shell as Terminal Mode, where you can trigger routines via a command line. If you type “help,” you’ll be presented with a list of supported commands and their meaning. One that I find myself often using is the “ldvs” command, which provides a list of the current data values from just about everywhere on the vehicle. You can think of it as a massive data dump. What I like to do is save that text in a text document and then use my favorite AI app to parse and ask questions.
Here’s an example of some of the data found from an ldvs command:
- BMS_beginningOfLifePackEnergy,82.100
- BMS_chargePowerAvailable,@invalid
- BMS_debugDisable,false
- BMS_debugEnable,false
- BMS_energyBuffer,3.230
- BMS_energyDisplayErrorBlendRate,1.125
- BMS_energyRemainingDisplay,41.040
- BMS_energyRemainingTDisplay,40.560
- BMS_enoughEnergyForConvenienceFeatures,true
- BMS_expectedEnergyRemaining,42.020
- BMS_idealEnergyRemaining,42.020
- BMS_minPackTemperature,12.500
- BMS_nominalEnergyRemaining,42.420
- BMS_nominalFullPackEnergyRemaining,71.700
- BMS_packMass,464
- BMS_reservedConfig_0,15
- BMS_subUsageId,36
- BMS_thermalPackType,2
- BMS_usageId,4
The following is a short summary from an AI conversation I had about an ldvs dump:
Summary — Battery health verdict
Current estimated health — ~81–83 percent of original nominal capacity remaining (~17–19 percent degradation).
Still very usable — Plenty of life left, especially since you're above the 70 percent warranty floor.
Normal for the age/mileage — A 2018 100D with over 216k miles showing this level of degradation is not alarming; many similar cars are in the 78–85 percent range at this point.
Recommendation — Schedule service for the smart fuse* replacement soon (Tesla often replaces it proactively when this code appears). If you want the most accurate health picture, ask Tesla Service to run a full Battery Health Test (it can take 8–12+ hours and gives a precise percentage of original capacity).
*The comment referring to the smart fuse came from errors listed in the data dump elsewhere.
Conclusion
I think most will agree that Tesla’s approach to diagnostics can be very fruitful for service technicians tasked with service, maintenance, and repair. While some manufacturers today offer remote vehicle access and access to cloud vehicle data, this is typically restricted to the OEM dealerships. If you’re looking to get more involved with Tesla vehicles, I recommend a Toolbox subscription and gaining access to a vehicle to explore on. This is the path I took to learn, and I’m enjoying gaining knowledge on these machines every day!
About the Author

Scott Brown
Founder - Diagnostic Network
Scott is an ASE Master Certified Automobile Technician with L1, L3, & L4 credentials and has over 39 years of professional service industry experience. As an independent shop owner in Southern California and with his engagement at various levels of within our industry, he continuously strives to move the industry forward through networking, education, communications, and training. Scott is a founder of the Diagnostic Network (https://diag.net/) which was born in 2018 after he retired after 22 years at iATN, where he served as company president.
Brown is also the host of Professional Tool and Equipment News (PTEN) and VehicleServicePros.com podcast, Torque Factor. The podcast addresses the latest automotive service technologies while focusing on expanding knowledge and awareness around tools, equipment, education, and industry trends.