Testing digital mass airflow meters
Measuring volume and density of air flow entering an internal combustion engine (ICE) is critical to ensure the system is operating efficiently and within the emissions specifications. Many versions of airflow sensors have been utilized in recent decades. These include, vane type, Karman vortex, and hot wire type. These sensors all had issues with reliability and/or performance. The vane type created an obstruction to the air entering the engine, the Karman vortex type had issues with accuracy due to external vibration, and the hot wire type had accuracy issues due to the back flow of air, which has been previously measured.
The hot wire type uses the cooling effect of air over a heated wire at a constant temperature. A current is applied to the hot wire, which results in a temperature increase. Increased airflow results in a greater cooling effect. The engine control module (ECM) increases the current flow through the hot wire to maintain the specified temperature. This current flow is proportional to the mass of air entering the engine. The output from this sensor is analogue and must be converted to a digital signal within the ECM.
The development of the hot film mass airflow meter (HFM) provided a more accurate and reliable method of measuring airflow. The design of the HFM also uses a thermal method to measure airflow similarly to the hot wire type. However, the HFM ensures the direction of airflow is measured.
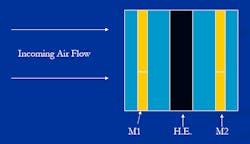
The basic concept is based around two measuring elements separated by a heater element. As air enters the HFM, a temperature drop is detected across the measuring element 1 (M1) and then passes over the heater element (H.E.), raising the temperature of the air, and resulting in a higher temperature measured at the measuring element 2 (M2). Reverse airflow is detected when the temperature change measured is reversed. It must be noted that only a percentage of air entering the mass airflow sensor (MAF) is sampled.
A further improvement with the HFM is the addition of signal processing electronics to convert the analogue signal into a digital output. This ensures accuracy of the signal as the sensor ages.
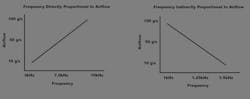
The signal output is a 0 to 5V digital signal. Most sensors output an increased frequency as the airflow increases. However, on some variants the frequency is inversely proportional to airflow, but these tend to be rare.
Digital mass airflow meters are more reliable, but they can prove difficult for technicians to test. Although, by using a good fault finding process the technician can validate the operation of the sensor.
Serial vs Parallel diagnostics
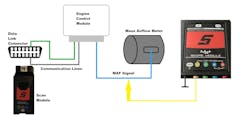
Serial diagnostics is a term used when a scan tool is connected to the data link connector to communicate with the vehicle control modules. The data displayed on the scan tool has been processed by a control module, so if a fault exists with the control module or a substituted value is used, the scan tool will display this incorrect data.
Parallel diagnostics refers to using a test device, like an oscilloscope or digital/graphing meter, to test the electrical signals between a component and a control module. This is the actual raw signal from a sensor or the control of an actuator.
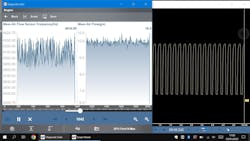
Ideally a technician would observe both serial and parallel diagnostics simultaneously. This can be done on the Snap-on Zeus+ by using a split screen as seen below. The scanner live data graph is on the left of the screen and the frequency graph view is on the right.
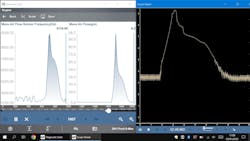
Mass airflow meter scanner live data and frequency (graphing meter) at idle

We can see from the data above that the frequency of the signal from the airflow sensor at idle is ≈3.7kHz. This equates to an inferred airflow of 6.3 grams per second.
Mass airflow meter scanner live data and frequency (graphing meter) at wide open throttle

The image above shows the same data parameters during a wide open throttle test. The frequency peaks at ≈9.2kHz, which equates to 98.7 grams per second.
Mass airflow meter scanner live data and voltage (oscilloscope) at idle
The waveform on the righthand side of the image shows the actual digital trace at idle using the oscilloscope. It is difficult to see the change in frequency due to the timebase (5 millisecond) required to display such a high speed digital signal. For this reason, we selected the frequency measurement from the graphing meter.
Information provided by Snap-on Diagnostics
About the Author

Damien Coleman
Damien Coleman started as an apprentice in 1999 at a GM dealership. In 2003 he competed in the final of the national skills competition. He completed his diploma in advanced automobile engineering and automobile electricity in 2004. In 2006 Coleman joined and started his career at Snap-on. In his spare time he has lectured at the Cork Institute of Technology, teaching automotive diagnostics.