Leveraging your Scan Tool's Strengths and Recognizing Weaknesses

Scan tools have come a long way since I began using them in the early 1980’s. My first exposure to such a tool was a pivotal point in my career. After connecting the tool to a few vehicles, I began to imagine what the future might look like one day. While back then the tool was mainly focused on engine operations, it was able to present vehicle information to the technician for analysis while sitting in the driver’s seat. A few years later, I saw my first vehicle that displayed scan data on a center display, and this was the beginning of a new era of data. Today, we're seeing a data explosion, with some bringing much of the vehicle data right to the center stack and displaying it in ways making it easier for technicians to analyze and diagnose vehicles more efficiently.
Today, we have access to not only extensive data points spanning across multiple networks, but we also have access to contextual data such as service information and, in certain instances, artificial intelligence, which we will dive into further later in this article. In my professional opinion, technicians who possess the necessary skills and knowledge to utilize this information will generally encounter less friction when servicing modern automobiles.
More than a code reader
For the most part, the scan tool is translating coded data either being broadcast or the tool is polling (requesting) data from modules. We need to understand that it is always possible that the data being decoded by the scan tool, or the requests being made, may be subject to errors.
This holds true even for OEM tools. In fact, sometimes you may find yourself seeing an analog value, such as voltage, being displayed for a signal that doesn’t match the physical value being measured. Referencing service information in these instances may save you some grief. I saw such an issue recently on Diagnostic Network [diag.net/msg/m1u492zrao0hdrvorkhlegnt1n/] where a no-code fuel gauge performance issue was being diagnosed. Repairs had already taken place, and the problem persisted. Action plans had been made based upon a discrepancy in the physically measured voltage versus the scan tool voltage level reported. Later in that thread, service information provided a clue by referring to a fault code related to the system under review:
“The Primary and Secondary Fuel Level Sensor Signals (saddle tanks or dual tanks) are hard-wired to the Body Control Module (BCM). Both Fuel Level Sensor signals are a constant 12.0V. On a normally functioning system, the raw signal voltage will read between approximately 0.5V (full stop) and 4.5V (empty stop). When there is an open in the circuitry, the signal circuit voltage is 12.0V. The data reading value on the scan tool is clipped to read 5.0V when the signal circuit is open. The BCM reads the voltage and converts the analog signals to digital signals. The digital signals are broadcast over the CAN bus.”
So, as you can see, when performing diagnostics, take the time to validate your findings. Reference service information theory of operation, even on something that seems straightforward, because it can “byte” you!
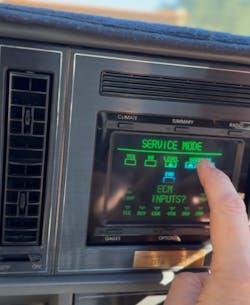
Health Checks - Toyota Techstream, Autel, Bosch (Shop Management Integration)
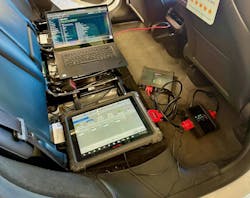
Automobiles are complicated machines, and as a service provider, we perform a full scan on pretty much every vehicle passing through our facility. One of the scan tools in our arsenal is the Bosch ADS 525x. It is wired up to our shop management program (Shop-Ware), and when we perform a full vehicle scan, the results are automatically published into the work order. This is an absolute time saver, and I hope other tools can be integrated this way in the future. Your shop management system may offer such features, so you might want to check into it.
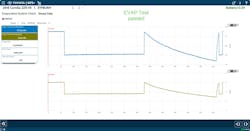
One of the strengths I find to be highly useful is the EVAP System Performance Test (Figure 3). I’ve written about this in the past, and I believe this persistence is warranted.
When you’re facing an evaporative system fault, this test is a great one to begin your diagnostics, as it will perform a baseline test to show you if the problem currently exists. And if so, you can repeat this test once repairs have been performed. If the system passes, in most cases, the EVAP monitor will be set to complete.
Electric Vehicle Data
Based in Southern California, EVs and hybrids are popular in our market. Although today’s scan tools provide quite a bit of information, the visualization of that data leaves a lot to be desired. For many years now, we’ve been using the Autel scanners along with the EV add-on, and it has been improving ever since its introduction. We do a fair amount of pre-purchase vehicle inspections, and their tools help us inspect and produce battery health reports.
In fact, Autel’s EV offerings provide the ability to read and gather additional information, often exceeding what the OEM offers. For example, if you were to perform a pre-purchase inspection on a Tesla Model 3, one of the checks we make is to gain some perspective on the battery and the overall vehicle efficiency. Using Tesla’s official tool, Toolbox 3 and their HV Battery CANBUS interrogation tool, you would be able to pull up some basic metrics, but what’s missing is historical data on charging, charging types, propulsion energy consumption, regeneration, and more. Of course, this could change down the road since Tesla is a Software Defined Vehicle (SDV). However, today it falls short of what Autel offers.
With the properly provisioned Scan Tool and EV add-on tools, one can quickly gather this information and compare the vehicle’s odometer to the energy numbers and gain a sense of the vehicle’s overall efficiency. Additionally, Autel has been continually enhancing its EV offerings by providing additional tools for gauging battery health.
Data Visualization - Data Charts & Graphs with filters
As mentioned earlier, today’s vehicles produce a tremendous amount of data. This can lead to technicians becoming overwhelmed at times. Tools that allow the technician to effectively chart, graph, and display information help us not only understand more about what the vehicle’s behavior is, but also provide consumable information for our clients, especially when we’re able to share results. In my opinion, this adds value and helps to build credibility.
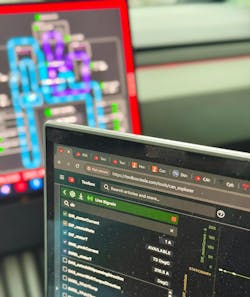
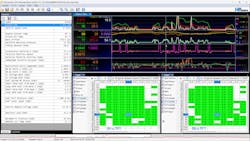
Even if they’re not consuming it, we like to include this data within the work order in case we ever need to refer to it later. Case in point, this is an example of a quality control (QC) road test we perform after some driveability-related complaints.
Looking at the lower left of the screen in Figure 6, you can see that the duration of this recording was 26 minutes. The table (graph) on the lower right represents the Long-Term Fuel Trim (LTFT) for both banks during the road test.
Data Metrics - Drowning in data - Math Channels, understanding what the data means
It’s easy to start drowning in data, and in some cases, it helps to visualize data in ways that help promote a better understanding of the vehicle’s condition and behavior. Most tools today allow for data graphing or charting over time, but some of these displays leave a lot to be desired. Many years ago, I started to see discussions around “cells” and how the on-board controller would reference data based on these cells. The only tool at the time I recall being able to display data in cells was the DRBIII, which was an OEM tool utilized by Chrysler Corporation at the time.
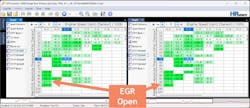
Referring to Figure 6, the graph/table displays the data populated across the engine’s operational range of manifold pressure and RPM. The data is populated with the amount of trim applied to the fuel delivery calculation.
Being able to view data in this fashion can be quite eye-opening for the driveability technician. For example, we recently had a vehicle arrive after having the gauntlet of parts replaced, trying to solve an intermittent poor idle, stalling complaint with a MIL with various fault codes. The issue was caused by a sticking EGR valve, which unfortunately had already been replaced. The clues were observed within the LTFT graph, as shown in Figure 7.
Back more than 20 years ago, I started working for a professional racing team supporting engine performance calibration. We had recently set up a MoTeC system on a C5R Corvette, and the calibration tools we used were quite remarkable and were able to display data in the ways discussed in this article. That, coupled with the data logging and analysis software, enabled us to visualize data in ways that really helped us understand performance metrics at a much higher level.
EVAP System Tests
OEM tools have their strengths (and weaknesses), and until you’ve seen what they have to offer, you’ll never know what you might be missing or disappointed with.
As mentioned earlier, the EVAP system performance test scan tools offer can be invaluable. In our state, we have an inspection and maintenance (I&M) program for vehicle emissions, which requires motorists to have their vehicles inspected every two years. Up until late 2025, motorists were allowed to have the EVAP OBDII Readiness Monitor set as incomplete and still pass inspection.
Today, all monitors must be complete to pass inspection. As you know, EVAP Readiness isn’t an easy monitor to complete. Being able to leverage the power of a scan tool to help with completing monitors is golden. Capable tools can leverage the services running within the ECM to initiate the test routines needed to run and test the EVAP system. However, some conditions, such as soak time, temperature, etc., cannot be bypassed.
Conclusion
I have no doubt that there will be no shortage of data; it’s going to be up to the technician to make sense of it all and adapt to how the data can be accessed, analyzed, visualized, and more. With artificial intelligence, proper knowledge, and training, I have no doubt that you can be successful well into the future.
About the Author

Scott Brown
Founder - Diagnostic Network
Scott is an ASE Master Certified Automobile Technician with L1, L3, & L4 credentials and has over 39 years of professional service industry experience. As an independent shop owner in Southern California and with his engagement at various levels of within our industry, he continuously strives to move the industry forward through networking, education, communications, and training. Scott is a founder of the Diagnostic Network (https://diag.net/) which was born in 2018 after he retired after 22 years at iATN, where he served as company president.
Brown is also the host of Professional Tool and Equipment News (PTEN) and VehicleServicePros.com podcast, Torque Factor. The podcast addresses the latest automotive service technologies while focusing on expanding knowledge and awareness around tools, equipment, education, and industry trends.