Finding the limitations of your tools
Key Highlights
- Tools act as extensions of a technician’s mind, helping test hypotheses only when their capabilities and limits are understood.
- A simple test light can mislead, since even with doubled resistance, it may still appear bright and hide a circuit fault.
- Dynamic tests like voltage drop testing reveal issues that static readings from a multimeter can miss in fast-switching circuits.
- Even advanced lab scopes have limits, as long capture times can distort waveforms and create false impressions of faults.
- Understanding your tools' limitations is the key to accurate diagnostics.

Every tool you own has a limitation. It’s easy to see with something like a ratchet — a short one doesn’t provide enough leverage for high torque, while a long one makes it hard to feel low torque accurately. The same holds true for diagnostic equipment.
Contrary to popular belief, it doesn’t matter how much or how little you spend on diagnostic tools — every single one has its limitations. And if you don’t know what those limitations are — what the tool can and cannot do — you’re in for a world of hurt. You’ll end up relying on that tool for information, and even if you understand what you’re looking for, if the tool can’t accurately show what’s happening within a component, system, or circuit, you’ll be working with bad information.
Tools as extensions of your mind
One thing I want to point out is that tools, if you really think about them, become an extension of our mind. They allow us to behave like the scientists we are. Once we understand how individual components work, we can see how they come together as a system to accomplish a goal. From there, we can carry out tests to determine whether a function was performed correctly, either by a single component or by the system as a whole.
We form hypotheses based on our fundamental knowledge of what should be happening, and it’s our tools that let us test those hypotheses and reach diagnostic conclusions —whether something’s broken or everything’s fine. The tests we perform give us the answers we’re looking for. However, that brings us back to the point about limitations: if we don’t know what a tool can’t do, we may rely on it for information that isn’t correct. And even if we know what we’re doing, bad information still leads to bad diagnostic decisions.
Pushing tools to their limits
Today, we’ll be testing tool limitations based on what I’ve learned over the course of my career about implementing tools. I’ll be carrying out some tests — essentially taking these tools for a test drive — to see what they can do and, more importantly, what they can’t. By pushing them to their limits, we can better understand what’s really happening within the components and circuits we’re testing.
We’ll use several tools — a test light, a digital volt-ohm meter (DVOM), and a lab scope. Each of these offers valuable information when used correctly, but each also has limitations. I want to show you what those limitations are and how to identify them for yourself.
This matters because if you’ve ever watched a truly skilled diagnostician, it looks effortless — almost like a game. That’s because they know how to implement their tools the right way, using them as extensions of their mind to test hypotheses and make accurate diagnostic decisions quickly. But when a diagnostician doesn’t understand what their tools can and can’t do, that’s when bad decisions happen.
The test light
Let’s take a look at this functioning light bulb circuit. It’s simple — a switch to turn the circuit on and off, with no other resistance in place besides the light bulb itself. What we have here is essentially a switched resistor; we can switch the resistor in or out of the circuit. When the resistor is switched off, it acts like a fusible link, bridging the gap in the circuit board.
Now, the light bulb’s resistance measures about 7 ohms. Check out Figure 1 to see the change in brilliance of the bulb as I switch in the resistor. You can see a slight change in brightness, but it’s so small that if you blink, you might miss it. The bulb still appears nearly the same, even though we’ve added resistance.
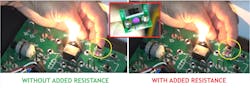
In this circuit, we can see the bulb illuminate to a certain brightness. But our eyes can’t measure that brightness precisely. When we added resistance nearly double the bulb’s own value, the change in brilliance was minimal because the circuit already has relatively high resistance.
The point is that the light bulb here can represent an incandescent test light or a noid light we might use on a fuel injector circuit. The bulb illuminates, so we assume the circuit is healthy. But as this test shows, even when resistance doubles, the light still appears the same — potentially misleading a technician into thinking the circuit is fine when it’s not.
The digital multimeter
Let’s take this a step further and apply the same fault using a different tool. This time, we’ll use an ohmmeter to measure the resistance of both the light bulb and the added resistor. Remember that the light bulb alone measures about 7 ohms. When we switch the resistor into the circuit, the total resistance increases by nearly 50 percent (Figure 2).
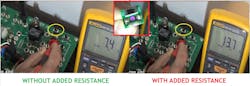
You can see that the ohmmeter clearly shows the issue, while the test light did not. The light still appeared nearly the same even though resistance doubled. The ohmmeter, however, revealed an increase in resistance, pointing to a fault in the circuit. It doesn’t tell us where the fault is — that would require isolating components — but it does confirm a resistance problem.
Now, what if that same fault existed in a circuit that functioned, but not well — a more dynamic circuit that switches on and off rapidly? In that case, an ohmmeter wouldn’t be the right tool.
Looking back at our circuit, the red lead measures the voltage feed, and the white lead measures the ground side, or injector driver control. Since this is a ground-side driven injector, there’s no voltage when the circuit is inactive. When we turn it on, the DVOM shows nearly source voltage — about 12V. Using the DVOM’s Min/Max mode, we see a highest reading of 12.12V and a lowest just under 12V, less than a 200 millivolt difference.
You might wonder, ‘How can that be?’ The capture rate of the DVOM is simply too slow to register the quick changes happening in the injector circuit. The ohmmeter could only show that a problem existed, not where. To pinpoint the fault, we’d have to open the circuit and test at different points. But with a more dynamic test, like a voltage drop test, we can allow current to flow and measure voltage across the circuit in real time. This method reveals faults without disassembly because the circuit is being tested dynamically.
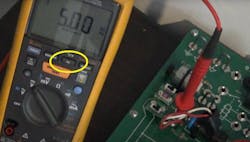
Now let’s look at a circuit that operates dynamically and changes state very quickly. To better capture what’s happening, we’ll use a different function on the DVOM. By pressing the Frequency button, we can see it reads 5 Hz — meaning the injector is firing five times per second (Figure 3).
So, let’s do a quick recap. Even though the DVOM is a step up from the simple light bulb brilliance test—and the ohmmeter left us guessing because we’d need to take the circuit apart to find the fault—voltage drop testing gave us more insight by allowing current to flow dynamically. However, on this fast-switching injector control circuit, the DVOM’s update rate was too slow to accurately capture voltage changes in voltage mode.
By using the frequency function, we can at least see how quickly those injector pulses occur. But remember, the goal here is understanding tool limitations. While the frequency mode shows pulse rate, it still can’t identify whether a fault exists in the circuit. That’s where a lab scope becomes essential.
The lab scope
Replace our meter leads with the scope leads and switching in our added resistance, let’s review the first waveform capture from the fuel injector. Remember, the injector was functioning normally until we introduced unwanted resistance.
Looking at Figure 4, you can see the circuit being sampled with the lab scope in the red outlined box. An ‘X’ marks before and after the resistance was switched in. On the left, the injector operated normally; on the right, we introduced additional resistance. This shows exactly what the DVOM showed us — a full injector cycle lasting about 200 milliseconds, which equates to roughly five injector cycles per second, matching the DVOM’s frequency reading.
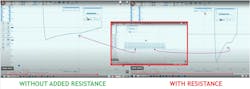
But now let’s focus on what the DVOM didn’t show us. Looking closely at the voltage drop, the normal injector waveform shows about a 120-millivolt drop across the injector (Figure 4 – left-hand side), which is completely normal. However, once the added resistance was introduced on the ground control side, the voltage drop spiked to nearly 1.7 volts (Figure 4 – right-hand side), which is a significant change that neither the light bulb test, the DVOM in voltage mode, nor the DVOM’s frequency reading revealed.
Those were the limitations of those tools. The lab scope, however, showed us exactly what we needed to see.
A lab scope’s limitations
As you can see, the lab scope covers nearly everything we’ve discussed so far. It lets us see available voltage, voltage drop across the injector, injector pulse frequency, and any corresponding voltage drop occurring away from the injector. That pretty much gives us everything we need to see.
However, we have to remember that every tool has its limitations. Even what many consider the best tool in an automotive technician’s arsenal, the multi-channel lab scope, has its own. The lab scope relies on its high sampling rate — how often it takes a measurement and plots a data point. That overall sample rate is shared among all active channels, so the more channels you use, the fewer samples each channel receives. Likewise, the more time you display on screen, the more those data points must be spread out to cover the full time base.
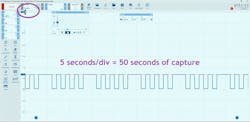
To demonstrate this, we’ll use our simulator board to capture a crankshaft position sensor signal. I’ll capture this in two aspects — one correctly and the other incorrectly — and we’ll take a closer look at the differences.
In the first capture, the scope is set to five seconds per division, so about a 50-second sweep. The scope handles this easily, and when we zoom in, the waveform appears as a clean, healthy square wave transitioning between 5V and 0V (Figure 5), exactly as it should.
Now, look at the same signal captured at 500 seconds per division. This leaves us with an hour and 23-minute capture. The sample rate is the same, but those samples are now stretched out across a much longer time frame. As a result, the square wave now appears triangulated and distorted (Figure 6), as if there’s a problem with the sensor or reluctor wheel. But there’s nothing wrong with the system at all—this distortion is simply a limitation of the scope.
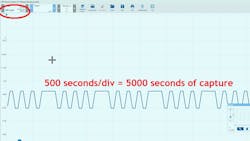
I don’t know of a scope, at least in the automotive field, that can record an hour and a half of data and still maintain a high enough sample rate to accurately represent the waveform that would be exhibited from a rotating reluctor wheel past a Hall effect crankshaft position sensor. The transition time between sample points becomes very deficient.
Final thoughts
So, what do you think? As you’ve seen, every single tool I showed you does indeed have a limitation. If you don’t take the time to discover those limitations, you’re doing yourself a disservice. It’ll take you much longer to become the efficient, accurate, and confident diagnostician we all strive to be.
Take the time to pull out your tools, test known good vehicles, and push those tools to their limits. Learn what they can show you and what they can’t. Once you understand that, apply those same tests to faulted vehicles — you’ll see how well the tools serve you once you know their boundaries.
A great benefit of doing this is that you’ll start learning to leverage your tools to infer information — allowing you to make accurate diagnostic decisions without tearing everything apart. Relying on your tools to deliver accurate test results saves time while maintaining accuracy, and that’s the goal. These new, more efficient tests will eventually replace the older, time-consuming ones, so make sure you’re staying ahead of the game.
Editor’s Note: This article is based on Brandon Steckler’s episode of Mastering Diagnostics #23: The Importance of Finding the Tools' Limitations.
About the Author

Brandon Steckler
Technical Editor | Motor Age
Brandon began his career in Northampton County Community College in Bethlehem, Pennsylvania, where he was a student of GM’s Automotive Service Educational program. In 2001, he graduated top of his class and earned the GM Leadership award for his efforts. He later began working as a technician at a Saturn dealership in Reading, Pennsylvania, where he quickly attained Master Technician status. He later transitioned to working with Hondas, where he aggressively worked to attain another Master Technician status.
Always having a passion for a full understanding of system/component functionality, he rapidly earned a reputation for deciphering strange failures at an efficient pace and became known as an information specialist among the staff and peers at the dealership. In search of new challenges, he transitioned away from the dealership and to the independent world, where he specialized in diagnostics and driveability.
Today, he is an instructor with both Carquest Technical Institute and Worldpac Training Institute. Along with beta testing for Automotive Test Solutions, he develops curriculum/submits case studies for educational purposes. Through Steckler Automotive Technical Services, LLC., Brandon also provides telephone and live technical support, as well as private training, for technicians all across the world.
Brandon holds ASE certifications A1-A9 as well as C1 (Service Consultant). He is certified as an Advanced Level Specialist in L1 (Advanced Engine Performance), L2 (Advanced Diesel Engine Performance), L3 (Hybrid/EV Specialist), L4 (ADAS) and xEV-Level 2 (Technician electrical safety).
He contributes weekly to Facebook automotive chat groups, has authored several books and classes, and truly enjoys traveling across the globe to help other technicians attain a level of understanding that will serve them well throughout their careers.