The king of all diagnostic tools and how to use it
Content brought to you by Motor Age. To subscribe click here.
What you will learn:
• Data should be captured in a fashion that tells the whole story
• Proper analysis of the proper data will lead to diagnosis
• Having the correct tools and knowing their limitations is a major factor in successful diagnosis
Ask any qualified and experienced diagnostician and they will tell you, "Figuring out what’s wrong with the vehicle or solving intermittent faults is not difficult. But getting the information needed to make these determinations is the real challenge.” It's important to have the correct tools for the job as well as know knowing the ins and outs of that tool's functionality.>The king of all diagnostic tools?
What tool am I describing? Well, that varies depending upon the job you are challenged with. In many cases though, it is the digital storage oscilloscope (DSO) or lab scope, for short. This is such a valuable tool because of its wide variety of uses and applications. The main reason being it functions on just about anything with an electrical impulse. A multi-channel lab scope will allow for action/reaction testing of signals simultaneously. True, there are limitations to voltage and such but there is almost nothing on today’s automobiles that it cannot be applied to.
On almost a daily basis I receive calls or inquiries online for assistance. The calls for help usually fall within these four categories:
- Help to understand what is causing the exhibited symptoms
- Help to pertain to which components to test
- Help knowing how and where to test/connect the lab scope
- Help to capture and decipher the data captured with the lab scope
The response I give to those inquires is always the same for each one of them individually. I always advise the technician to reflect upon data for guidance. The trick is to use data that is quick and easy to acquire (like scan data from the DLC). Determining which components to test would require one to reference service information, both for system/component operation description as well as a wiring diagram to see how the components function as a system. Understanding how a system is laid-out or configured will be your guiding light.
Knowing where to test is what is yielded from the wiring diagram and related information about connector terminal views and component location. Most of that stuff can be found quite easily and all can be done ahead of time, before messing about under the hood or dashboard. However, it’s the final inquiry in which many technicians get (at minimum) sidetracked or even buried in confusion and frustration.

What your tool can and cannot do
I can't begin to stress how important it is to know the tool's limitations, yet so many technicians take for granted what the tool is capable of. The lab scope (in this example) is nothing more than a device that measures the difference between the two test leads and captures samples in a specific domain. (Like voltage, pressure, amperage, etc.) It then plots these samples on a display, over time. The time factor allows for a view of the history of any signal being sampled. We don't have to have our eyes fixed on the display because that information is stored within the device. The plotted samples are dots that are connected to create a visual representation of the electrical impulse being measured.
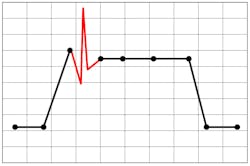
The sample rate is the first limitation that comes to mind. Sample rate describes how many samples (or pictures) can be taken over a period (reflected as "samples per second"). Although the benefit of having a multi-channel lab scope is to view different signals simultaneously, that sample rate is typically shared over the number of scope channels being used. In other words, the more data you choose to look at, the more likely an insufficient number of samples will be available to capture what is happening on the circuit being measured. This is known as "aliasing." It's plain to see that a poor scope acquisition could cause aliasing and lead to misdiagnosis (Figure 1).
The 1,000-yard stare
Another point to keep in mind is not only if the data was captured in the scope’s buffer (or storage tank) but also how we view the data on the display. Even if the fault has been properly captured doesn’t mean it will be visible to us, the analyst. Having the ability to alter the amount of voltage, current, pressure, etc. that is displayed on the screen (vertically) and the amount of time displayed on the screen (horizontally) will determine if we see it or not.
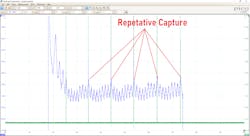
Viewing data in a repetitive view will allow us to see if a fault repeats itself, over and over again (Figure 2). Or this view is even helpful to catch a momentary loss of a signal or intermittent failure. Only having adequate time on the screen for analysis will allow that to occur.
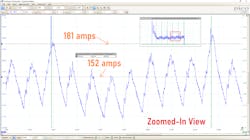
On the opposite side of the spectrum is a zoomed-in view (Figure 3). This view will allow us to see great detail that simply could not be viewed with more time on the screen. This type of view is typically required to see minor changes (in voltage, amperage, etc.). The trick is to know which type of view is necessary for the situation you’re faced with.
Finger on the trigger
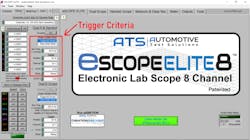
Probably one of the most overlooked aspects of the lab scope is a trigger function. Think of a trigger as a command to the scope on where and when to begin drawing the acquisition on the display. The trigger function has selectable criteria that allow for many nifty tricks to aid in capture capability (Figure 4). In many cases, the trigger function has up to four pieces of criteria.
- Position: For example, If the screen is divided horizontally and equally into 10 divisions. A position of "50 percent" will be halfway across the display. This will allow you to place the acquisition where you desire to see it, from zero percent to 100 percent.
- Level: This is an amplitude threshold. Each time the acquired data passes the threshold chosen the displayed information will be updated. If the new data doesn’t cross the threshold, the previous acquisition will remain on the display.
- Slope: This pertains to the direction of travel. In other words, a positive slope will determine the display will update as the threshold was chosen (level) is crossed while heading in a positive direction. A negative slope will determine the display to update only when the threshold is crossed in a negative direction.
- Trigger type: Triggers can be chosen as "single", meaning the first time the trigger criteria are met, the acquisition will display and be frozen on the display. A “repeat” trigger will update the display each time the trigger criteria have been met
The trigger function is extremely handy in some situations. It can allow a waveform to be stabilized on the screen for dynamic analysis. This is because the waveform will not only be redrawn when the criteria are met but also in the same location on the display. Suddenly signals that once seemed to dance across the display at ‘a million mph’ now seem to dance-in-place for us to watch their behavior. The best example I can give of this is when viewing a live ignition waveform.
However, using inappropriately a trigger can mask issues, especially intermittent faults. Think about it…If the signal intermittently drops out, the only acquisition drawn on the display was the previous "good-one." The events that do not meet the trigger criteria will be ignored. So, use the trigger function appropriately.
An example of this was an old Honda CR-V (distributor ignition) I was challenged with. The vehicle would stall very intermittently and would restart again without issue. After an extended road test, the vehicle was never faulted. Having a suspicion, the fault was heat-related, I allowed the vehicle to run (in the shop) while I tended to other jobs.
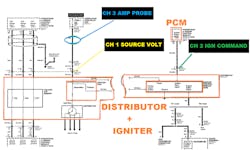
Because of the nature of the fault and the vehicle's ignition system configuration, I suspected a loss of spark to be the cause of the stall. Now, to prove it I referenced a wiring diagram then interfaced 3 channels of a lab scope to the vehicle (Figure 5). The key was I utilized the trigger function to capture the data. The scope was set up as indicated below:
- Yellow: B+ to the distributor assembly
- Green: Low-side driver command from PCM to the igniter to control the ignition coil dwell
- Blue: Coil current
The strategy used the trigger function to serve as a “pause feature.” I set the trigger criteria on the coil current trace (blue) using a negative slope. You'll notice the little "blue" cross-shaped target to the right of the coil ramp (Figure 6). This indicates the trigger position on the screen.
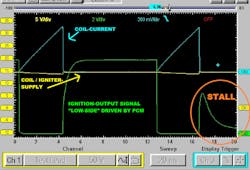
Using the negative slope means the scope will only draw the capture when the blue channel trigger level is crossed when the current is traveling negatively past the threshold. Placing the trigger position to the right of the screen allows for two things:
- Because a stall would prevent the coil from firing, a stall will also cause the scope to draw the previous coil current ramp to the right of the screen.
- This same feature allows everything that occurred before the stall to be frozen in time on the screen.
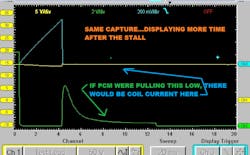
What I'm alluding to is I didn't even have to be present when the car stalled. I was washing my hands when the fault occurred. But, the data I needed to make a diagnostic decision was waiting for me on the scope display when I returned (Figure 7). The lack of current flow (blue) combined with the loss of the coil command (green) and no loss of switched-ignition voltage (yellow) led me to determine the fault was not external but internal to the distributor assembly. An ongoing issue for two summers was solved without disassembling and was done so with ease. But, the fix isn’t what I’m focused on here, it’s the journey.
Being a good diagnostician doesn’t mean you’re necessarily smarter than anyone else. It means having a solid understanding of how things work, a game plan in place, and equally as important, a strong knowledge of your tool's functionality. When you know what your tools can and cannot do you can test appropriately, and it becomes very easy. It’s easy when you go fishing with a net instead of a hook.
About the Author

Brandon Steckler
Technical Editor | Motor Age
Brandon began his career in Northampton County Community College in Bethlehem, Pennsylvania, where he was a student of GM’s Automotive Service Educational program. In 2001, he graduated top of his class and earned the GM Leadership award for his efforts. He later began working as a technician at a Saturn dealership in Reading, Pennsylvania, where he quickly attained Master Technician status. He later transitioned to working with Hondas, where he aggressively worked to attain another Master Technician status.
Always having a passion for a full understanding of system/component functionality, he rapidly earned a reputation for deciphering strange failures at an efficient pace and became known as an information specialist among the staff and peers at the dealership. In search of new challenges, he transitioned away from the dealership and to the independent world, where he specialized in diagnostics and driveability.
Today, he is an instructor with both Carquest Technical Institute and Worldpac Training Institute. Along with beta testing for Automotive Test Solutions, he develops curriculum/submits case studies for educational purposes. Through Steckler Automotive Technical Services, LLC., Brandon also provides telephone and live technical support, as well as private training, for technicians all across the world.
Brandon holds ASE certifications A1-A9 as well as C1 (Service Consultant). He is certified as an Advanced Level Specialist in L1 (Advanced Engine Performance), L2 (Advanced Diesel Engine Performance), L3 (Hybrid/EV Specialist), L4 (ADAS) and xEV-Level 2 (Technician electrical safety).
He contributes weekly to Facebook automotive chat groups, has authored several books and classes, and truly enjoys traveling across the globe to help other technicians attain a level of understanding that will serve them well throughout their careers.