Pressure Waveform Analysis: The Art Following the Acquisition
Daily, I receive requests to aid in pressure waveform analysis. It's something I enjoy doing as it's part of my way to give back to the industry that took such good care of me. Some believe it portrays mastery of the subject, but I'm not too much better than any of you, just a tad more experienced in this realm. Truthfully, it's all just a matter of perspective. But I'll share with you what gives me success in analysis. I'll show you how I manipulate the in-cylinder compression waveform to the point where I can draw a diagnosis.
Scope Setup
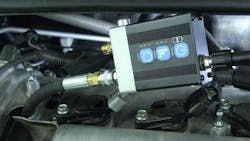
I'll be leveraging a Pico scope/pressure transducer because they're the most widely used tools in the automotive industry. However, you do not need a Pico scope or WPS500 (Pico pressure transducer) to perform the testing or the analysis. There are many capable tools on the market, and I own several of them.
The first thing I want to mention is the proper time base for engine mechanical pressure waveform analysis. Capitalize on the scope's capability. A 20-second time base (or 2 seconds per division) is the best choice (Figure 1). This will give you enough time to capture all the information required.
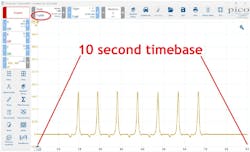
Capturing this data with this much time on the screen will allow you to operate like a bird of prey. You hunt from several thousand feet in the air for a bird's-eye view. We refer to that as a "trend view" (for obvious reasons). I prefer to see things occur over and over again. It's easier to see faults when cycles repeat. We can zoom in for details later (caution: not every scope will let you zoom in later. Some scopes will only let you zoom out).
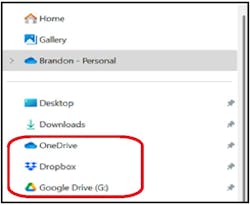
Capture the data in raw format (meaning no filtering). Then, immediately save the captured file to a safe and accessible place; I recommend the cloud (Figure 2). If I don't save right away, I tend to forget, or if I filter first, I may inadvertently filter out some desirable information and ruin the capture's ability to yield a diagnosis.
Preparing for Analysis
Part of proper analysis is setting yourself up for success. Too many times, I'm asked to analyze a still screen capture. Most of the time, the picture I'm offered isn't focused properly, leaving diagnosis off the table. It's simply a ruined opportunity. Regardless of how good a diagnostician you may be, if you cannot see the data, you cannot draw an accurate conclusion. You must first prepare to analyze.
Begin by zooming into your trend view (from above) to the point where one cycle fills the screen. We refer to this now as a "detailed view." Select the rulers from the toolbar and apply phase rulers (Figure 3). This will then allow you to partition the in-cylinder waveform four ways (to represent the four strokes of a complete engine cycle).
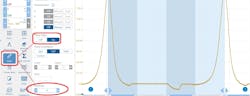
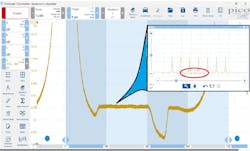
Figure 4
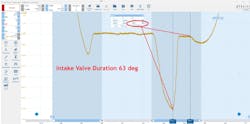
Zoom in once again (Figure 4) to fill the screen with only what you desire to see. In this case, I am interested in a few characteristics that I will view:
- Timing of the exhaust valve opening (EVO)
- Timing of the intake valve opening (IVO)
- Timing of the intake valve closing (IVC)
- The duration of the intake valve
- The negative pressure created in the cylinder during the induction stroke
The characteristics, or points of interest, are of the utmost importance for engine mechanical and breathability diagnostics. But to view those characteristics, I'll have to manipulate the capture for clarification; this involves a bit of filtering. Filtering is a double-edged sword. It will allow you to clean up a capture, but it can also degrade one. Only filter as much as required.
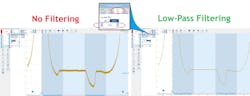
The two types of filtering I use are resolution enhancement and low-pass filtering. It's important you know the difference between the two. Active filtering allows me to select a low-pass filter threshold of my choice. In this example, a 1-kilohertz low-pass filter was selected. What that means is any portion of the signal that toggles faster than a rate of 1,000 times per second is removed from the waveform. It's like taking an eraser and removing the hairiness from the waveform (Figure 5).
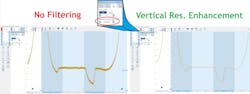
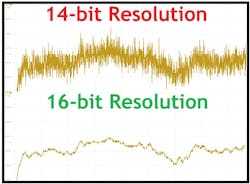
The other type is vertical resolution enhancement. This type of filtering creates a similar effect to the pressure waveform but goes about it in a different fashion (Figure 6). If you can imagine an 8-bit scope screen broken up vertically into about 4,100 discrete points. These points are opportunities to place a "dot" (as in connect the dots). Well, the way a scope plots data is by looking at the dot as a threshold. If the value measured by the scope exceeds the dot, it must place the dot at the next vertical opportunity. With that, waveforms can tend to look fuzzy. Now, increasing the vertical resolution to 16-bit offers the scope over 65,500 discrete points. If the threshold for a dot is exceeded, the next dot is not much further away, reducing or eliminating the hairiness (Figure 7).
Leveraging Measuring Cursors
If you weren't aware, a diagnostician is only as precise as the tooling he or she leverages. With that, capitalize on what your precision measuring devices have to offer. Powerful digital storage oscilloscopes will have a pair of vertical cursors (for measuring a point in time and/or elapsed time between the two of them). They will also have a pair of horizontal cursors (to measure the value of a signal in its selected unit of measure, or the difference between the two of them).
I leverage the vertical cursors to indicate when valves open or close. Using the pair of them, one can easily determine the duration of an event. This is a great way to reveal a worn cam lobe or even a collapsed lifter, as displayed here (Figure 8).
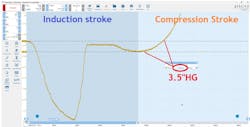
The horizontal cursors are great for indicating when a cylinder isn't breathing properly. Whether it's a labored inhalation or exhalation, the cursor will make light work of it. As we can see in this example, during the third quadrant of the capture (the induction stroke), as the piston descends in the cylinder bore, rather than displacing air and filling the void in the expanding combustion chamber, the cylinder is drawn into a negative pressure, or what we mechanics like to refer to as vacuum. The pair of horizontal cursors indicates that the piston simply can't move air into the cylinder (Figure 9).
Data Storage for Later Review
As mentioned in many previous articles, a good diagnostician is always looking to improve or understand at a deeper level. It's for this reason that I highly recommend taking the time to save your captured data properly and thoroughly. You simply can't count on your memory to serve you correctly after troubleshooting thousands of cars each year. You need to take the time to be sure all pertinent information is included in your file for review at a later date.
So, how can we ensure we have everything we need in the document? Well, if you can send it to another technician on the other side of the world, and he or she can determine what is wrong in the capture (by way of the story the data tells and by the notes attached to the capture), you have done your job sufficiently. Here is the information I like to include in the file:
- File name: Chevy Avalanche in-cylinder
- Odometer: 165,698 miles
- Operating conditions: Cranking, closed-throttle, fuel disabled
- Engine configuration: 5.3L V8, N/A, with active fuel management
- Scope channel: A = Relative compression, B = Intake pressure, C = Ignition, D = In-cyl)
- Conditions: "Good," "Bad," or "Unknown"
- Notes: Found damaged #8 intake valve lifter
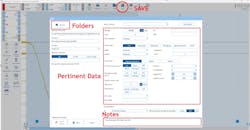
The information above, for the example vehicle, allowed me to analyze the data accurately without the vehicle in my presence or the diagnostic technician available. He did a fantastic job labeling his captures, which allowed me to do my job as an analyst (Figure 10).
There is an equally important aspect of saving data, and that has everything to do with where you place that data. When I began my adventure of a deep dive into diagnostics, I found myself saving very valuable data in the most random locations. I was more like an unruly teenager than I was a professional diagnostician. I had data irresponsibly stored anywhere within one of four USB thumb drives, a hard drive, on the desktop of at least three PCs, and on a couple of SD cards. It sometimes took hours to find what I was looking for. I'd spend the time searching through hundreds of improperly labeled captures on one media device before switching to another device to continue the process. Needless to say, I've learned my lesson the hard way. There is a much better way to store data. My recommendation is to place the data in the cloud.
Begin by opening a folder on the desktop of your PC. Label the folder by way of the vehicle. I typically name the folder the appropriate year/make/model/symptom. In that folder, I place captured data from graphed scan data, video files, lab scope files, thermal imager files, etc. If you'll notice, the common word used is "files." It's important to save files so you can interact with them. The ability to manipulate the data to display what you desire to see is of the utmost importance. Don't misunderstand, it's fine to save screenshots or pictures, but always include the file from which those pictures were derived. Screenshots can always be captured from a stored file after the fact.
Remember, my filing system may differ in structure from yours as I provide technical support to diagnosticians across the globe. For instance, I have data for my business stored on one of three different cloud-based storage facilities (Google Drive, Microsoft OneDrive, Dropbox). Don't ask why, it's just the way it's always been for me. However, I only store automotive-based data in the same facility.
I have one main folder labeled "Automotive Diagnostic Support" and a series of subfolders that follow in a logical system. It is as follows:
OneDrive > Automotive Diagnostic Support > Client Name > Subject Vehicle
All the data from that particular vehicle gets stored in that same folder structure. In this fashion, nothing gets lost, and it's very easy to locate, even years later. I store information on the cloud because when my PC crashes, or if I don't have access to it at the moment, the information will still be accessible, regardless of where I am in the world. As long as I have an internet connection.
Proving the Process Works
In the grand scheme of things, we do whatever it is we do (as diagnosticians) to solve the issues causing the symptoms our clients are experiencing. Hopefully, we are getting to the root cause of the symptom and not simply fixing the symptom itself.
Regardless, our processes exist for a reason, but if one were to break down my information- and analysis-based diagnoses, you'd realize that all of the information I base my diagnostic decisions on is bits of the story to be told. And when I have the pieces of the story fitted together (like puzzle pieces), I almost always have a conclusive diagnosis that aligns with them.
Our diagnostic data should tell that story. That is how you know you have captured the right data. Let's walk through the entire story of this poor Chevy truck as the data suggests.
Although the data was not visible in the captures demonstrated earlier, a four-trace lab scope capture demonstrated the following:
- Relative compression
- Intake manifold vacuum
- No. 1 ignition synchronization
- In-cylinder compression #8 (suspect-cylinder)
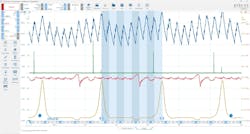
The data in those captures suggested that one of the eight cylinders was not performing like the other; the suspect cylinder (correlated with the ignition sync) was determined to be cylinder #8. The in-cylinder compression waveform illustrated the cylinder's inability to inhale, and the vacuum trace confirms not only that a duration issue with the #8 intake valve lifter exists, but also that the issue is in fact a collapsed lifter (and not a worn cam lobe).
The late occurrence of the suspect cylinder's vacuum transfer points shows the shift in time. However, they are still very crisp and abrupt. The same characteristics can be seen in the in-cylinder waveform. A worn cam lobe would show the same shift in time, but there would tend to be less of an abrupt transfer point as metal displacement from the cam lobe would hinder its opening smoothly (Figure 11).
So, as you can see, it's certainly not magic but an ability to understand and analyze the data you have captured. If you don't capture and/or save the data properly, you have no data to manipulate to show you what you need to make a diagnostic decision. And, without that, you simply can't be as precise as is required (not without extensive disassembly and evaluation).
Also, take the time to understand how things work. Take the time to understand how to leverage the tools that show you the story to be told. Take the time to capture and save data properly because the consequence of not doing so would lead to regret and many hours of repeated tests. Finally, capitalize on your tools' features and capabilities to ease and streamline this process for you. There's definitely a reason certain tools require a larger investment of money. The takeaway is that it is an investment. And leveraging the tools as I have described above will help you realize that return on investment a heck of a lot sooner.
About the Author

Brandon Steckler
Technical Editor | Motor Age
Brandon began his career in Northampton County Community College in Bethlehem, Pennsylvania, where he was a student of GM’s Automotive Service Educational program. In 2001, he graduated top of his class and earned the GM Leadership award for his efforts. He later began working as a technician at a Saturn dealership in Reading, Pennsylvania, where he quickly attained Master Technician status. He later transitioned to working with Hondas, where he aggressively worked to attain another Master Technician status.
Always having a passion for a full understanding of system/component functionality, he rapidly earned a reputation for deciphering strange failures at an efficient pace and became known as an information specialist among the staff and peers at the dealership. In search of new challenges, he transitioned away from the dealership and to the independent world, where he specialized in diagnostics and driveability.
Today, he is an instructor with both Carquest Technical Institute and Worldpac Training Institute. Along with beta testing for Automotive Test Solutions, he develops curriculum/submits case studies for educational purposes. Through Steckler Automotive Technical Services, LLC., Brandon also provides telephone and live technical support, as well as private training, for technicians all across the world.
Brandon holds ASE certifications A1-A9 as well as C1 (Service Consultant). He is certified as an Advanced Level Specialist in L1 (Advanced Engine Performance), L2 (Advanced Diesel Engine Performance), L3 (Hybrid/EV Specialist), L4 (ADAS) and xEV-Level 2 (Technician electrical safety).
He contributes weekly to Facebook automotive chat groups, has authored several books and classes, and truly enjoys traveling across the globe to help other technicians attain a level of understanding that will serve them well throughout their careers.