During my five plus decades of being in the automotive service and repair industry I have learned that diagnosing an engine performance problem, drivability problem or electrical problem is not an exact science.
GM teaches a thing called Strategy Based Diagnostics while Ford has their pin point charts. Some manufacturers supply us with the conditions to set a code such as what the PCM needed to see to set the code and what the conditions were to set the code. I have always favored symptom-based diagnostics, where once we have identified the symptom we focus our testing on a specific area. All of these things have a certain amount of merit but the truth is the technician working on the car is basically alone.
I would like to compare the technician to a baseball pitcher. A pitcher is on the mound and he is all alone. It is he who has to decide what pitch to throw and to what location. He gets the signal from the catcher and it is he who must decide what pitch to throw and to what location. He may even shake off the catcher’s sign. Yes, he has the defense to back him up.
We as automotive technicians are like the major league pitchers. Some of us are very good with a good winning record. Having said that, not one of us has always batted 1000%.
All of us technicians have had our share of butt whippings just like a major league pitcher who has suffered the loss. We have our support in technical training, technical articles we have read and our past hands-on experiences, and we take advantage of sources such as YouTube and our technical information systems like Mitchell On Demand, All Data and Identifix. We may even have a coworker who can help give advice. Even so, we are like that major league pitcher on the mound. We are basically all alone. It is the technician who makes the call as to what test equipment to use and what to test.
We all know of the diagnostic value of our scan tools and are also aware of the limitations of the scan tool. In cases of a misfire code the misfire could be caused by a secondary ignition failure such as worn spark plugs of a defective coil or secondary lead. Based on the all-time high in odometer readings of vehicles that are currently on the road today, the problem may be compression related such as cylinder blow by, leaking intake or exhaust valves, wiped cam lobes, lean or rich density misfires or a retarded cam timing issue. To dynamically pinpoint the cause of a misfire for example, the Digital Storage Oscilloscope (DSO) offers us the ability to find the cause of the misfire. In addition, the DSO gives us the ability to view and analyze PCM inputs and output PCM drive signals as well as bus circuit signals — all of this done dynamically with the DSO. On my travels across the country teaching automotive technology, I find that roughly 10% of the techs attending have a DSO and use it.
I also know several shops that have purchased a premium scan tool that includes a DSO and a multimeter which are never used. Before we begin our digital waveform analysis lets take a look at Fig. 1 of a standard DSO screen. The vertical scale has 10 major divisions and will represent voltage. The horizontal scale represents time. We can monitor voltage changes over time. There are 10 major divisions on the horizontal scale. Each major division on the vertical and horizontal scale includes five minor divisions.
More importantly we can determine the integrity of the waveform. One of the most important functions of a DSO is the ability to view a secondary or primary ignition event to determine the cause of a misfire. One well known automotive instructor has stated that “there is more diagnostic value from a primary or secondary ignition waveform than any other waveform on any other automotive application. In an earlier article titled the Anatomy of Waveform, which can be found in the August 2021 edition of Automotive Service Professional, we provided much detail on analyzing primary and secondary ignition events.
In this article we will briefly touch on primary and secondary ignition events when using a DSO. First let’s discuss the secondary KV probes needed when using a DSO. See the two examples in Fig. 2 and Fig. 3.These probes have an attenuation factor of 1000 to 1. What this means is that if the voltage per division setting is 1 volt per division, the attenuation now becomes 1Kv per division. Fig. 3 is known as a COP (coil on plug) wand. This wand was designed to inductively pick up a secondary event from a COP unit by simply laying the probe to the top of a COP unit.
Some modern COP coils are so heavily potted that the magnetic field is too weak to pick up with these probes. On the heavily potted COP units a secondary lead can be used between the COP unit and the spark plug and then clamp the universal secondary probe around the lead. However, many of the COP coils will emit a strong enough magnetic to display a secondary event when using the COP wand. This probe works as well by laying it next to a secondary lead on distributorless ignition systems. It is important to remember that secondary firing events on COP systems are negative firing events so the invert function must be used on the DSO. On distributorless ignition systems, half of the firing events are negative events while the other firing events are positive firing events, where we would turn off the invert function. On distributor equipped engines, all secondary firing events are of the negative polarity so the invert function must be used. If you are scope checking the primary side of the ignition system the invert function must be turned off since these are positive firing events. Let’s look at a good example from a DSO in Fig. 4.
The time base is set at 1 millisecond per division with the voltage per division at 1Kv. When viewing a secondary firing event the most important portion is the spark at idle and no load condition. The minimum spark duration period should not go below 1 millisecond during an idle and no load condition. Once the mechanical condition is verified, I never chase a misfire symptom with worn original spark plugs with an odometer reading that shows a six-digit reading. There is an exception on the multi-fired coils on late model Ford engines where the PCM will fire the coils as many as three times when RPM is below 1,000 RPM. Above 1,000 RPM the Ford systems will revert back to a single firing event. The first three spark duration periods will measure about 0.5 milliseconds. When adding up all three events the spark duration period will add up to more than 1.5 milliseconds. Then with a light power brake condition, the duration period drastically shortens up and the spark line bends upward. This is the indication of a lean condition. Again we gave much more info and detail in our previous article titled The Anatomy of a Waveform.
When using a DSO there are five cardinal rules that must be known and used to obtain a good stable DSO waveform. See Fig. 5. Some DSOs are equipped with various presets which basically will get you in the ballpark but may not be the best seat in the house, which means you may well have to change some of the voltage, time and trigger level settings. Some DSOs have an auto sync function whereas the scope will sample the incoming signal and pre-configure the time and voltage per division settings. The same results are predictable. The first consideration is to determine the scope trace mode. The auto selection is the most popular in that a trace will be on the screen without even being connected to a circuit. The second choice is normal, meaning that the DSO will not display a trace on the screen until a specific trigger level is seen by the DSO. This scope trace mode is commonly used to detect a signal drop out. If the trigger level is not seen by the DSO then the missing event can be easily seen. The third choice is the most critical in the trigger level and trigger source. If a waveform is not seen or is unstable on the horizontal scale, then the trigger level or trigger point is not seen by the DSO. In addition, the proper trigger source must be selected. For example let’s say you are doing a single trace with channel one, then the trigger source for channel one must be selected. When doing a dual trace, triple trace, or a four trace you must select which channel is to be used for the trigger source. The fourth setting is known as the trigger slope. The two choices are either positive or negative, or rising or falling. If you are scope checking a device that is ground-side controlled by the PCM, then the negative slope would be the best selection. When you are viewing a secondary waveform for example, the rising slope would be the best choice.
The fifth consideration is the probe selection. The standard DSO leads have an input impedance of 1 to 1. This means that 1 volt per division represents 1 volt per division on the vertical scale. In cases where it may be necessary to scope check a primary event, then a 10 to 1 probe would be needed. The reason being is that the maximum voltage per division is 10 volts on many DSOs and there are 10 divisions on the vertical scale then a maximum voltage display would be 100 volts. A primary ignition event varies between 250 volts to 350 volts depending on the system. Without using a 10 to 1 adapter the internal circuitry of the DSO could be damaged. Some scopes actually use a 20 to 1 attenuation probe. With a 10 to 1 probe this means that if the voltage per division is set at 5 volts per division we simply multiply this value times 10 which now becomes 50 volts per division. This primary ignition check is very popular on the Ford and Chrysler systems where the primary drivers are in the PCM. We would simply back probe the negative coil terminal to obtain a primary ignition waveform. We noted in our previous article that a primary ignition waveform gives us the same diagnostic value as that of a secondary waveform. These two waveforms will literally mirror each other. See Fig. 6. When using a DSO to scope check the secondary circuit, a 1,000 to 1 probe would be needed. In addition, when scope checking the primary or secondary side of the ignition system always use the peak detect mode of the DSO.
Let’s take a look at a common hall effect crank sensor that generates a 5V/0V toggle in Fig. 7. On the Snap-On scopes the time base icon represents the total horizontal time on the screen. Notice in Fig. 7 the total time on the screen indicates 50 milliseconds. With 10 divisions on the horizontal screen each division represents 5 milliseconds. We suspected a faulty hall effect CKP sensor was causing a jerk and buck symptom. Notice Fig. 7. The waveform looks flawless even though the symptom is consistent. The peak detect mode is on.
Now let’s take a look at Fig. 8. We increased the time on the screen to 500 milliseconds or 50 milliseconds per division. Since we are still in the peak detect mode we increased the time base to increase our chances of seeing the signal drop out as indicated in Fig. 8. Some DSOs have a zoom function where we can automatically zoom in on the signal. The DSO simply decreases the voltage per division and decreases the time base. This is sort of a magnifying effect. In addition, on the Snap-On scopes the voltage icon represents the total voltage on the vertical scale instead of a voltage per division. For example, if the Snap-On scope screen indicated 20 volts it represents 2 volts per division.
Let’s take a look at a common digital type signal from a magneto resistive type crank sensor found on many GM engines. The symptoms include an intermittent good crank and no start along with an intermittent jerk and buck symptom. The PCM has set a crank sensor code. Two separate replacements of the CKP sensor did not solve the problem. We tapped into the CKP signal wire and obtained the waveform in Fig. 9. Notice the scope settings are at 5 volts per division at a 20 millisecond per division time base. Notice the trigger level is set at 3 volts on the rising or positive slope. This sensor generates a good 8 volt to 0 volt toggle. You can easily identify this bad signal in Fig. 9. A redundant sensor signal circuit was installed and verified the problem was gone.
Let’s look at a linear type signal from a TPS in Fig. 10. The symptoms included loss of cruise control function along with a surge type symptom. During a KOER TPS sweep test notice the signal dropout in Fig. 10. If your scope is equipped with the single sweep mode the single sweep mode can be used. Using the single sweep test the DSO will begin drawing a trace when a trigger level is met and then freezes the waveform.
Whenever you are trying to detect a signal dropout or glitch you should always use the peak detect mode of the scope. This function puts the scope in the maximum sampling rate. Without the peak detect mode, signal dropouts or glitches may not be seen by the DSO. On the typical DSOs the sampling rate is proportional to the time base. The sampling rate increases as the time per division is decreased to a faster time per division. So as the time per division is increased the sampling rate decreases. This is why the peak detect mode is so important. In my opinion the minimum peak detect mode should be a minimum of 10 megahertz. That means the signal is sampled 10,000,000 times a second. Some modern day scopes greatly exceed that sampling rate. Back in the ‘80s there were a lot of arguments about the live analog scopes versus the digital DSO, whereas some techs argued that the live analog scopes gave you a better chance of catching a glitch. I simply don’t agree with that in light of the fact that the human eyeball updates at best four times per second. Another point I would make is that with the conventional analog scope you cannot record or freeze a waveform to analyze it. So it looks like the digital DSO is here to stay.
Signal tracing the oxygen sensor with a DSO can yield a lot of information. Let’s look at a good zirconium oxygen sensor signal in Fig. 11. Notice the uniform rich to lean shifts and lean to rich shifts with a clean waveform. Now let’s look at an oxygen sensor from a vehicle with a rough choppy idle condition in Fig. 12. Notice the vast amount of hash on the oxygen sensor signal. The likely cause here is a lean density misfire. This sensor can be easily graphed out when using the scan tool but the vast amount of hash will not be seen.
The alternator on today’s engines is a major player. Alternators generate A/C voltages that must be rectified by the rectifier bridge and diodes inside the alternator into D/C voltages. PCMs can only identify D/C voltages. An alternator with a failed diode will create unwanted A/C voltages into the PCM and circuits. This usually creates a laundry list of DTCs along with severe engine performance issues. The DSO can easily detect a failed diode inside the alternator. We simply clamp the positive DSO lead to the feed wire of the alternator. I know that many of the alternators are buried and not easy to access. You could probe into the feed wire as close to the alternator as possible. Checking for A/C at the battery will not work since the battery acts as a big shock absorber.
Let’s take a look at this test in Fig. 13. The scope is A/C coupled which blocks out the D/C voltages. I like to teach that negative A/C voltage over 400 millivolts could spell problems. Notice that the ground tick mark is located in the middle of the screen. A/C voltages below this tick mark are of negative polarity. The scope is set at a 10 millisecond screen time or 1 millisecond per division. On the vertical scale above and below the ground tick mark is 50 millivolts. Since this is the Snap-On unit, each division represents 5 millivolt. Notice that the maximum A/C negative voltage is 9 millivolt.
Most scopes have a function known as a low pass filter which helps block out unwanted electrical noise. For example, when scope checking a TPS sweep with the engine running, the scope leads could inductively pick up the magnetic fields from a secondary lead. If you are scoping out a signal whereas the trace has a lot of hash, the low pass filter could be used to clean up the trace. Another example may include signal tracing the oxygen sensor where you may need to use the low pass filter function. There are premium scope leads that are heavily shielded to prevent unwanted electrical noise that can be picked up inductively by the scope.
A Honda Odyssey came into the shop with a high idle complaint. The idle would not go below 1,200 RPM. Normally we would all suspect a major vacuum leak. Smoke checking the intake system indicated no vacuum leaks. Blocking off the IAC air passage did not lower the idle RPM. There were no DTCs from the PCM. The TPS was checked and proved to be functional. With a DSO we decided to check the PCM drive signal to the IAC solenoid. See Fig. 14. This solenoid is ground-side controlled by the PCM. The on time is where the voltage is pulled to ground. The waveform tells us that the PCM is in control of the IAC control solenoid. There were no PCM codes. When doing a bus circuit sweep test, we discovered a traction control code stating loss of communication with the PCM. When doing a wiggle test at the ABS header connector the RPM came down. After doing a park to drive shift the RPM came down to a steady 600 RPM. We cleaned the male and female terminals to correct the connection problem. I can’t explain the strategy that Honda used to create this high RPM problem when the PCM loses communication to the ABS module. The RPM increase was caused by the PCM advancing the spark timing.
On today’s modern day vehicles several modules communicate data to each other such as fuel level, engine speed, engine load, throttle angle, vehicle speed, brake input, A/C request and many more. A corrupted bus network can create a host of problems including lack of communication to the scan tool and loss of communication between modules. It is likely to have a host of U series codes on the scan tool if you can even communicate with the network. A DSO would be the prime tool to determine if the network is corrupted. There are several different types of bus circuits but all are of the digital type signals.
First let’s dive into the GM class 2 network in Fig. 15. This is a single wire network that can be signal traced at pin two of the DLC.
Notice the good 7 volt 0 volt toggle. A Chevy Silverado came in with an intermittent loss of the electronic throttle control with a P1518 code. In addition, the radio would turn off and the door locks would cycle. Since all of these components are controlled on the class two network, the car finally acted up with our scope connected to pin two of the DLC. Notice the corrupted signal in Fig. 16.
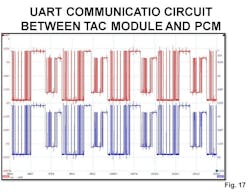
The PCM would shut off the throttle and set the ETC code. On the early GM truck lines a TAC module is used to communicate with the PCM on a 2 wire UART (universal asynchronous receiver) type bus circuit. The TPS and APP sensors report their position to the TAC module. The TAC module then communicates this data to the PCM on the UART network. The PCM then sends the throttle command to the TAC module and the TAC module driver sends the command to the TAC motor. The TAC module then communicates their position to the PCM on the two-wire UART network. The TAC module drives the TAC motor by commands from the PCM. See a good UART signal from this vehicle in Fig. 17.
With the radio turning off and the door locks cycling we know that these functions are controlled on the class two network. The voltage spike seen in Fig. 16 was from the TAC module’s bad ground and the voltage spike was back feeding from the UART network into the PCM and corrupting the class two network. A poor TAC module ground was found on the back side of the intake manifold. Another example of a corrupted class two network was from a Cadillac Deville with an intermittent no crank condition. A bus circuit sweep test showed a laundry list of U series codes. Because of that we suspected a corrupted class two circuit. Using a DSO, we probed terminal two of the DLC during KOEO conditions. The 7 volts 0-volt toggle looked normal in Fig. 18.
Now during a cranking attempt notice the DSO trace came well above ground in Fig. 19. This tells us there has to be a ground problem somewhere. Voltage dropping the starter ground circuit showed nearly battery voltage. The ground cable between the block and body was defective. Remember on these cars, the battery is under the rear seat.
The most common bus circuit on today’s modern day vehicles is a two-wire high speed network known as CAN. On all CAN compliant vehicles the CAN high terminal reports data to pin six of the DLC, while the CAN low data reports data to pin 14 of the DLC. See Fig. 20. The top trace is CAN high and the digital toggles begin at a 2.5 voltage level and at that level the circuit is at rest. When the voltage jumps to 3.5 volts it means that a module is communicating. Pin 14 CAN low data is the bottom waveform; 2.5 volts is at rest. When the voltage jumps down to 1.5 volts it represents data and that a module is communicating. If these signals are corrupted we would need to monitor the waveform as we unplug one module at a time to see if the waveform is corrected.
In our future articles we hope to include current ramping by using the low and high inductive amp probes interfaced with the DSO and another article covering the use of a vacuum and pressure transducers interfaced with the DSO.
You may be thinking of investing in a DSO or if you already have one you may be motivated enough to start using it and going through the buttonology learning curve much like you did on your scan tool or cell phone. The question is that if you look in the rear view mirror of your past experiences in diagnosing drivability issues, were there any cases where you could have done, may have done or should have done testing with a DSO to locate the problem quicker and more efficiently? I can assure you that in the future you will see a need to use a DSO.
The industry is better because of your commitment.
About the Author