Accessibility to components in order to do a signal trace on a voltage waveform could be a challenge. In addition, back probing a connector or piercing a wire can disturb the circuit. If you remove a relay and jumper across the power side of the relay, or remove a fuse and jumper across the fuse in order to current ramp a fuel pump, the circuit has been disturbed. A non-intrusive test involves using the low inductive amp probe interfaced with the Digital Storage Oscilloscope (DSO) and monitoring the current ramp values and the integrity of the amperage waveform when using the DSO.
Virtually every 12 volt output device that is controlled by the PCM can be current ramped by using the low inductive current probe non intrusively by simply clamping around the voltage feed wire or the ground side control wire. Amperage probes are not polarity sensitive, meaning if the waveform indicates a negative polarity we would simply reverse the amp probe or use the invert function of the scope.
In our DSO diagnostics article in the October issue of Auto Service Professional we specifically covered the five cardinal rules for good lab scope usage. We are going to remind our readers again about these important five rules in Fig.1.
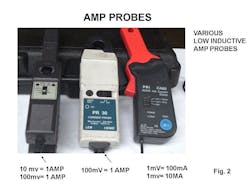
Low inductive amp probes can vary in their attenuation settings, so first and foremost we must always be aware of these attenuation settings. Notice Fig. 2. (See above.) The amp probe on the left has two attenuation settings. The first setting is for every 10 mV = 1 amp. This would be the choice on a circuit that may draw as much as 40 amps. The second attenuation factor set represents every 100mV = 1 amp. This is the most popular attenuation setting and should be used on circuits that draw less than 20 amps which would include virtually every PCM output device.
The center amp probe has one setting: for every 100mV = 1 amp. This is my favorite setting. The amp probe on the right has two settings: one for every 1mV =100 mA and the second is for every 100 mV = 1 amp.
If you are current ramping a circuit that requires less than 20 amps, the 100mV = 1 amp setting would be preferred. On circuits where the amperage value can reach 40 amps, the 10mV = 1 amp would be preferred. The 100mV = 1 amp setting would be the first choice for most automotive applications. Most low inductive amp probes should not be used on circuits where the amperage exceeds 40 amps. The high inductive amp probes are designed to diagnose amperage values that exceed 40 amps such as starting circuits. Note Fig. 3. The two attenuation factors are 40 amps that can be used for charging circuits or the 400 amp setting that is used for starter current draw.
Access to the secondary circuit on some modern engines is very difficult when checking for spark using a high energy spark tester. Using a low inductive amp probe clamped around the voltage feed wire to the coils somewhere in the harness can determine whether or not we get an ignition event.
Let’s take a look at Fig. 4. The attenuation factor is set for every 100 mV = 1 amp. This is the most popular attenuation setting and my favorite. Notice that the current ramps measure 6.5 amps.
Just as important as the amperage values is the clean turn off point of the amperage waveform, representing a good transfer of energy from the primary side of the coil into the secondary side of the coil. We pointed out the critical points of a primary amperage waveform in Fig. 4. Many systems such as GM and Ford will clamp the current flow from the internal circuitry of the ignition module or the primary drivers inside the PCM to about 6.5 amps. A primary amperage waveform from a Chrysler DIS system is indicated in Fig. 5.
The GM COP units can peak to nearly 10 amps on a cold startup. Note the amperage waveform in Fig. 6 from a GM COP unit. The vertical setting is set at 200 millivolts equal 2 amp. You can see that the amperage value is about 10 amps. This provides a longer spark duration period.
In our previous article we covered the importance of viewing the spark duration periods of a secondary or a primary ignition voltage waveform. A primary amperage waveform will not show us this important factor. Problems in the secondary circuit like fouled plugs, bad ignition modules, and poor coil saturation such as weak coils or bad module grounds and internal coil carbon tracking can be detected by monitoring the primary ignition amperage waveform. Let’s go ahead and show you some primary amperage waveforms from some problem vehicles.
In Fig. 7, notice there is a missing primary event from this GM DIS system. A closer look shows a slight stair step current ramp. This slight ramp is the current ramp to the base and emitter part of the transistor that controls the primary current flow. The problem could be in the module or open primary windings inside the coil.
After the ohmmeter check of the primary and secondary windings of the coil checked OK, the module was replaced. Fig. 8 shows a good uniform coil current ramping with no signs of internal coil carbon tracking. Another example of where an amp probe could help in our diagnostics is indicated in Fig. 9.
Notice the steep current ramping of the first primary event. This could be caused by a dead short in the secondary circuit or a totally fouled spark plug. This waveform was captured from an integrated direct ignition system where using a spark tester would be very difficult. We simply clamped around the B+ wire outside of the valve cover. The second current ramp looks normal.
A Honda with a V-6 3.5L engine came in with a rough idle and a lack of power complaint along with a dead miss you could easily feel. A visual was performed and found nothing out of the ordinary. A scan tool was used to check for codes and found none. We clamped our current probe around the B+ feed wire to the COP units and observed the waveform in Fig. 10.
Notice the missing coil primary amperage event from the No. 3 coil. The No. 3 trigger signal from the PCM looks good. The No. 3 coil was replaced and scope checked again as in Fig. 11. Internal coil carbon tracking is one of the leading causes of coil failures and misfires. Note Fig. 12. Notice the indication of electrical activity after the point of primary turn off from a coil with internal carbon tracking.
Modern day ignition systems are of the divorced type, meaning there is no hard-wired circuitry between the primary windings of the coil and the secondary windings. The two windings are separated by an air gap inside the coil. When primary current flow is turned on by the module a positive magnetic field builds on the primary side of the coil. A negative magnetic field also begins to build in the secondary circuit. The opposing magnetic fields create a counter voltage effect between the two circuits.
In Fig. 13 we dual traced a primary coil current event along with a secondary event. The DSO setting for the current probe is set at 20mV per division and the DSO setting for the secondary voltage trace is set at 10 volts per division. This gives us a magnifying effect of the point of primary turn on. If the secondary is shorted including a totally fouled plug you will not see these oscillations. If you refer back to Fig. 9 you will see the missing oscillations.
Checking for fuel pressure has become more difficult on many systems because many manufacturers have done away with the convenient fuel pressure test point. Current ramping the fuel pump with an amp probe can easily verify whether or not we have fuel pressure, as shown in Fig. 14.
On conventional port fuel injection systems, 4 to 6 amps is very close to 40 PSI. A good formula is for every 1 amp = 10 PSI. See Fig. 15.
In addition to the amperage value, the amperage waveform oscillations can help us detect electrical problems of the fuel pump such as open commuter bars or shorted windings. In addition, poor fuel pump grounds and a weak voltage source to the fuel pump will diminish the current flow value. Let’s look at some fuel pump problems using the low inductive amp probe interfaced with a DSO.
Fig. 16 indicates an open commuter bar causing an intermittent stall and no start. Fig. 17 is from a vehicle with a no start. Notice there are no oscillations due to a frozen pump. This is a car when you banged on the fuel tank you could hear the pump run.
On another vehicle in Fig. 18 the waveform on the left from the old pump shows a weak initial current surge of only 2.7 amps. At 10 milliseconds per division, it took 70 milliseconds for the pump to come fully on line. The waveform on the right is from the new pump. Notice the initial current surge is 8.4 amps and the fuel pump is fully on line in 70 milliseconds.
Notice Fig. 19 from a Ford Ranger with a complaint of long cranking times after an overnight cold soak. A fuel pressure gauge was installed and indicated 40 PSI during KOEO and during cranking with a normal startup with the engine fully warmed up.
We know that the injector on time during a cold startup will reach double digit injector on times which required good fuel pressure and volume from the fuel pump. We clamped a low inductive current probe to the fuel pump feed wire at the inertia switch. In Fig. 19 the initial current surge hit 25 amps then dropped to 22 amps followed by a brief open. After that the pump is on line at 7 amps. With the engine now running let’s look at the waveform in Fig. 20.
This is an eight-segment armature pump. The waveform looks very erratic and a new pump and fuel filter solved the problem. Analyzing the current waveform oscillations from conventional fuel pumps is an important diagnostic strategy.
On modern day vehicles a fuel pump control module duty cycle controls the fuel pump instead of a constant battery supply voltage found on the conventional systems.
The Ford fuel pump control module bangs the fuel pump with battery voltage 6,000 times a second and increases the duty cycle on time as engine load is increased.
The GM fuel pump control module bangs the fuel pump with battery voltage at 25,000 times a second.
As in the Ford systems, the duty cycle on time will be increased as engine load increases. Because of this the signature waveforms do not resemble that of the conventional fuel pump. However, the amperage value is of prime importance. Typically, during idle conditions these pumps draw about 4 amps. During a power brake condition, you will see an increase in amperage demand as the duty cycle signal from the PCM is increased.
Injector testing becomes very easy with the low inductive current probe. We simply clamp around the voltage feed wire or the switching side of the circuit. Fig. 21 shows a dual trace example of injector tracing with the voltage trace at the top and the current ramping waveform at the bottom.
If you look closely you will see a slight variation of the voltage trace and a slight variation of the current waveform. These represent the pintle hump as the mass of the pintle breaks across the magnetic field. Fig. 22 is from a problem vehicle with a PO306 misfire code. Current ramping the No. 6 injector shows three unstable pintle humps. This is known as pintle bounce. We informed the car owner we could try an injector cleaning process and the waveform on the right indicates a single stable pintle hump with no misfires.
Fig. 23 is from a V-8 tuned port engine where current ramped all eight injectors by clamping around the pink feed wire. These 12 ohm injectors should pull about 0.7 amps.
Notice that the No. 2 injector, the No. 3 injector and the No. 8 injector are electrically shorted. The No. 6 injector indicates an open winding. We triggered from the No. 7 injector.
Testing GDI injector drive signals has been more difficult. Using Noid lights and multimeters will not work. When signal tracing a GDI injector drive signal for a voltage trace you must use a two-channel trace, with channel 1 on one wire with channel 2 on the other injector wire. The PCM will charge capacitors with 65 volts for the injector circuits.
In Fig. 24 the first blue waveform on channel 1 indicates a 65-volt charge. The bottom red waveform indicates that the PCM supplied the ground and the injector is pulsed. Notice the amperage yellow waveform indicating a 7 amp draw since the PCM supplied the ground.
It is clear to see that using a current probe on these systems is much easier than doing a voltage trace. Moving to the right, notice the top blue trace indicates a 65-volt charge as well as the bottom red trace. The bottom blue trace is not pulled to ground and the injector is not pulsed. The green trace is the RPM IC signal from the No. 1 coil control. Notice the amperage yellow trace does not indicate that the injector was ground side controlled.
Mechanical integrity issues on high mileage engines have always been a concern as to what may be causing a misfire code, a misfire symptom or a lack of power symptom. A high inductive current probe clamped around either battery cable and then to conduct a WOT 10 second cranking test. The starter current flow will increase as each piston reaches TDC on the compression stroke. Note Fig. 25. Notice the uniform amperage value of 150 amps from a good high mileage engine. The low pass filter or noise reduction function of the scope was not turned on.
Fig. 26 is from a high mileage engine with a lack of power complaint. Notice the uneven starter current low on the cylinders from bank 1. This is caused by a retarded timing problem on bank 1. You must also entertain the possibility of a restricted converter on bank 1.
Current ramping is an easy art to learn and returns many good returns. In our next article we hope to cover the diagnostic value of the pressure transducer and the vacuum transducer interfaced with the DSO.
Thanks for your commitment to this very resilient industry. The industry is better because of your commitment.
About the Author