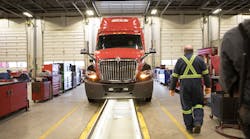
With the amount of data now available to fleets, there is more opportunity to deep dive into the analytics formulated by vehicle and company data. While cost-per-mile has been the primary metric for benchmarking and assessing the performance of a fleet’s maintenance operation, it’s just the tip of the iceberg.
Earlier this summer, the Truckload Carriers Association (TCA) held a forum to provide fleet maintenance personnel insight into best practices for maintenance workflow through a seminar titled Maintenance Workflow Best Practices, which is part of the TCA Profitability Program (TPP). TPP events are designed to provide best practices for fleets in any number of departments within the fleet operation such as maintenance, safety, and finance.
TCA Managing Director Jack Porter led this forum focused on maintenance, sharing insights from his time as a consultant for both dealers and independent fleets.
TCA’s TPP manages a benchmarking program with a select number of fleets, which provides data points to allow for industry comparison.
Porter and TCA Program Manager Chris Henry offered up some additional details on other key performance indicators (KPIs) to consider, to provide a more holistic approach to assessing the performance of a maintenance operation.
“We want to get this data to the frontlines,” Henry says. “With groups [within an organization], there’s a tendency to keep data at the principal level. You need to be able to provide this information company-wide so they have access to these tools and metrics.”
Some of those maintenance KPIs that were calculated through the TCA TPP benchmarking program included:
- Maintenance expense per mile. The median amount among the 20 participating fleets in the benchmarking program was $0.178; the lowest was $0.1027, and the highest was $0.241.“This [number] has grown immensely,” Porter says. “[A fleet needs] more metrics than just cost per mile. It becomes a pitfall because you’re not basing the information on the full picture.” The calculation here includes internal labor rates for technicians, overhead, and other data points.
- Maintenance expense as a percentage of net revenue. The average here weighed in at 9.56 percent. The lowest percentage was 6.42 percent, and the highest was 14.81 percent.
- Maintenance expense per truck, per week. A large range here: the lowest expense was $60.87 per truck, while the highest reported $380.79 per truck, with a median of $220.83.
- Maintenance expense per trailer, per week. With not as vast a range as the tractor segment, the median cost was $36.83 per trailer. The lowest reported cost was $24.18 per trailer, and the highest was $49.48.
- Tire expense per mile. For each tire, the expense per mile average was $0.0265. The lowest was $0.012, and the highest was $0.041.
- Maintenance expense per on-duty driving hour. Ranging from $6 to $9 per hour, the median cost was $7 per hour. For this calculation, Porter advised the data to calculate this figure used a combination of active, on-duty driving data from electronic logging devices (ELDs). It did not take into account idle time.
Attendees shared additional KPIs they monitor as well, mostly dealing with cost-per-mile (CPM), to help validate shop productivity, efficiency, and expenses. They mentioned items such as separating tractor versus trailer data, sometimes breaking out between make and model year; a summary of expenses by shop; a budget versus actual spending; and shop hours versus repair order hours.
Porter encourages fleets to select five to 10 KPIs to set a benchmark, and then track and review trends on a weekly basis. “You’ll then have a number you can compare to other like-carriers.”
Getting started
There are a number of strategies and processes fleets can adopt to ensure the accurate and thorough collection of data, and methods to communicate the results of that data with all staff members.
Be sure data and information is coded accurately and thoroughly. This includes information from reported accidents, damage, abuse, etc. Having detailed information aids in the comparison process, allowing fleets to know where the costs are coming from. As it relates to coding, also categorize damage under a different “bucket,” such as safety, to ensure those items aren’t factored into the overall maintenance expenses.
To start the reporting process, manage the hours spent on the shop floor. This is the only way a shop can measure productivity and efficiency, Porter says. In other words, total up the number of available working hours for all technicians and subtract vacation or time off. Then, establish and monitor standard repair times to have a comparison. In this instance, productivity is the number of hours paid versus the number of hours put into an actual job. Once you have this information and have established a benchmark, monitor progress through the setting of KPI goals, setting budgets, and tracking and reporting. Hold team members accountable and communicate with them to go over the numbers; set individual and team goals and show the big picture to the technicians.
This process can be daunting. Porter encouraged attendees to pick one thing to change first. Concentrate on that one thing to get the process started.
This month’s cover story, Do you know your TCO?, provides more insights on the importance of calculating the total cost of ownership (TCO) of a vehicle, and suggestions on how to begin the process of setting up a program that calculates and monitors TCO.
Is TCO integral to your fleet? If so, I’d love to hear more from you on how you established this process, and the changes – both successes and failures – you’ve monitored within your maintenance operations.


