Vehicle affected: All
Tools used:
- Code Reader
- Scan Tool
- DMM
- Waveform Viewer
- Labscope
- Information sources
For this Tool Briefing, we take a unique approach of comparing a number of different tools to use with the same diagnosis.
We all know that it is sometimes difficult to be both accurate and efficient. One of the primary needs of being accurate is to either possess or know where to obtain the knowledge to diagnose issues. Also essential is having the correct tools.
To become efficient, it is necessary to choose the correct tools, be able to sift through information quickly and rely on your experience to recognize patterns. You also must be aware that it is impossible to be efficient without being accurate.
In this month’s article, we will discuss how to improve both accuracy and efficiency by providing you with information on when and why to choose specific tools to perform a task. Since a common issue is an illuminated “check engine” light and observing oxygen sensor values during your diagnostic process, we will discuss the value of various tools to expedite an accurate analysis.
The diagnostic process and tool choices will be relatively consistent for most vehicles, but for this example we will use a 2004 Jeep Liberty with a “check engine” light illuminated to perform our tests.
Step 1: Use a code reader
I have used a code reader as my “first grab” tool for quite some time. The reason we use a code reader is that it is fast and there is enough information provided by the tool to make an informed decision on which direction to proceed with your diagnosis.
Most code readers will provide codes and let you know if the monitors have run. Codes are great, but knowing if any monitor has not completed can sometimes be a shortcut in determining what’s wrong with the vehicle, as well as understanding why a code you would expect to be present is not there.
For example, if driveability symptoms are consistent with a lean condition but there are no lean codes, it would make sense that there is not a lean code after knowing that the oxygen sensor monitor has not completed.
We also use the code reader to determine if we are able to use one of our aftermarket scan tools, or need a factory tool. The aftermarket tools in most cases are much faster than a factory tool, but in some instances may not be as efficient if there are OE-specific codes or if a significant amount of bi-directional testing will be required to test the system.
Using the code reader, we found a P0131 code and that all the monitors were complete.
Step 2: Obtain vehicle-specific information
Using ALLDATA and inspecting the vehicle, we determined there is one upstream oxygen sensor on each bank. The P0131 code is for bank 1. A code P0131 means that the PCM has detected low voltage (below 250mV) for 10 seconds.
Due to only one bank of cylinders being affected, we can assume that the issue is not system related, but specific to bank 1. Making early assumptions is easy to do, but not advised. Just to make sure we do not overlook basic engine needs, we installed a fuel pressure tester to verify the vehicle meets the specification and checked battery voltage to make sure it was sufficient. In many cases, it is a good idea to interview the customer to see if any additional driveability concerns were noticed. In the case of this Jeep, no additional information was gained from the customer.
Step 3: Install scan tool
Use your scan tool to first verify communication with all modules throughout the CAN bus. If any modules are not communicating, it may be necessary to repair them prior to beginning any other diagnosis. The reason you should do this is in some cases faults can be due to lack of communication, or a code that could be useful in the diagnosis may not set if modules are not communicating.
After you check for module communication, verify the code(s) you found with your code reader and record freeze frame data related to that code. I also recommend checking for pending codes to make sure there are no additional issues later on.
The operating voltage of a normal oxygen sensor will be between 100mV for low voltage (lean) and up to 900mV for high voltage (rich). During enrichment testing the sensor should go from rich (above 800mV) to lean (below 200mV) in less than 100 milliseconds (ms). In order for the vehicle to maintain fuel control and have the ability to store oxygen for proper catalytic converter operation, the sensor must be able to switch from full lean to full rich in less than 100 ms.
Current scan data shows the oxygen sensor is working normally.
Step 4: An analysis of each tool
Since we will be observing oxygen sensor values to determine if there is a current issue with the vehicle, let’s discuss the benefits of various tools to get information.
Since we are observing voltage, a DMM could be used. You would be able to connect the meter directly to the sensor or the PCM to read voltage. Using the min/max function of your meter you would be able to see both the lowest and highest voltage the sensor produced. The drawback with a DMM is that it cannot measure how quickly or slowly the sensor switches.
Using your scan tool can be a relatively effective way to observe sensor operation. One thing that is critical to remember is that your scan tool has a specific baud, or communication update rate. The more parameters, or PIDS, that are displayed on your tool, the slower the tool will show changes. This pertains to observing PIDS as well as using the graphing capabilities of the scan tool. If you are attempting to catch a “glitch” or an intermittent issue this is even more important to remember.
Most of the newer versions of scan tools have graphing capabilities. There are some cases where it is valuable to look at graphs with your scan tool, but since the graphs are not displayed in real time, some glitches in the vehicle system may not show up. Additionally, the ability of your scan tool to observe and store data for long periods of time may be limited. Storing large amounts of data can be useful for finding intermittent issues. Another drawback with a scan tool is there may be a loss of data while cranking and during initial start-up.
Using a waveform viewer also can be useful. But like a scan tool, the update rate and the storage ability may be limited.
A lab scope gives you the ability to observe voltages and other signals in a user-defined timeframe. Finding intermittent faults and having the ability to compare values of multiple sensors or actuators at the same time are just a few of the benefits of a scope.
Many technicians are hesitant to purchase a lab scope due to the cost and not having enough experience with the tool to use it effectively. However, the cost of lab scopes with multiple channels have decreased. Most now have extensive libraries built into the scopes and have “known good patterns” as well as enough information on how to connect and adjust the settings for most common components. Once you are familiar with using a lab scope, it can be very difficult to work efficiently and accurately without it.
Step 5: Select the appropriate tool for this diagnosis
Let’s look at each tool in turn with our Jeep.
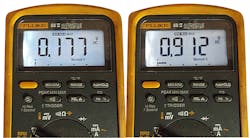
DMM – Using the min/max feature we observed a minimum voltage of 177mV and a maximum of 912mV. On the surface that seems normal, but we have no reference to time. In this case, the DMM is not that useful. You may want to keep the meter out just in case it is necessary to perform voltage or resistance tests later in the diagnosis.
Scan tool – Monitoring just the bank 1 and bank 2 oxygen sensor PIDS, we can see very close to the same data as the DMM, but we also can see the sensors changing data quickly. Graphing the two sensors can get a better picture of not only the voltage and how quickly they switch, but also see both sensors are relatively the same.
Waveform viewer – We are able to read one sensor at a time. Even though the screen is smaller than the scan tool, we can see data in closer to real time.
Lab scope – Since we have a multi-channel lab scope, we can see both oxygen sensors over a long period of time. We also have the ability to start the vehicle and get data instantly, allowing us to see things while the engine is cranking as well as when it first starts.
In this instance, we selected the lab scope. On this vehicle, having the ability to see data while cranking and immediately upon start-up showed that intermittently we would have an extended period of time when the voltage on the bank 1 oxygen sensor was below 200mV.
There are times when it is appropriate to rely on a single tool, and other times when it is necessary to use a progression of tools to provide the data you need. Choosing the right tool for any job allows you to increase both your accuracy and efficiency. You would not choose to use an open-end wrench as your only tool to remove an engine any more than you would choose to only use any one of the tools we discussed in this article for diagnosing an issue.


